
This is the third in a series of three articles exploring how we can improve the odds for our strategic investments by Quantifying Our Stories in Scenarios . . .
- Step 1: For Future Events
- Step 2: For Long-Term Cashflow
- Step 3: For Long-Term Cashflow Expectations at Earlier Horizons
In our previous article, Step 2: Quantify Stories in Scenarios for Long-Term Cashflow, we illustrated that it can really pay to call odds on multiple cases for a company’s future long-term cash flows. But as we noted at the end, most of us need to do more because our limited investment horizons require that we sell our investment in any company long before all its cash flows come to us. So going from cases for a company’s future cash flows to cases for our own investment returns requires making cases for someone else’s purchase price in the future.
That price is ultimately a human decision that can be influenced by many factors, like fear of missing out (“FOMO”), also known by finance quants as a “momentum factor.” But whoever is holding the bag at Warren Buffett’s “forever” horizon can simply depend on the company’s long-term future cash flow, so as one steps back to gradually earlier horizons, expectations for that future long-term cash flow maintain a strong magnetism on price, despite the other price influences like FOMO. In his book Expectations Investing, Columbia Business School Adjunct Professor of Finance Michael Mauboussin points out:
Extensive empirical research demonstrates that the market determines the prices of stocks just as it does any other financial asset. Specifically, the studies show two relationships. First, market prices respond to changes in a company’s cash flow prospects. Second, market prices reflect long-term cash flow prospects . . . companies often need ten years of value-creating cash flows to justify their stock price. For companies with formidable competitive advantages, this period can last as long as thirty years.
Cases for Expectations
Expectations for long-term cash flow can be expressed as stories, as described by New York University Finance Professor Aswath Damodaran in his book Narrative & Numbers: The Value of Stories in Business. He offers an example of our need to think through multiple cases for these stories at our investment horizon:
In my Uber narrative, I viewed Uber as a car service company that would disrupt the existing taxi market (which I estimated to be $100 billion), expanding its growth (by attracting new users) and gaining a significant market share (10 percent). The Gurley Uber narrative was a more expansive one, where he saw Uber’s potential market as much larger (drawing in new users) and its networking effects as much stronger, leading to a higher market share . . . The valuation that I produced for Uber with the Gurley narrative was $28.7 billion, much higher than my estimate of $5.9 billion. Given that the values derived from the narratives were so different, the question, if you were an investor, boiled down to which one had a higher probability of [investors embracing it at your investment horizon].
In fact, MIT Finance Professor Andrew Lo, whose finance research relies heavily on brain research, describes this anticipation of others’ narratives as the lynchpin of anything approaching market efficiency. In his book Adaptive Markets: Financial Evolution at the Speed of Thought, he explains:
The price-discovery process in a well-functioning market requires its participants to engage in a certain degree of cause-and-effect reasoning. “If I do this, then others will do that, in which case I’ll respond by…” This chain of logic presumes that individuals have what psychologists call a theory of mind, the ability to understand another person’s mental state.
We may need to anticipate others’ narratives at multiple future horizons. For example, we may have an expectation that we are confident will make us money within 3 years since the market’s expectation is likely to evolve to ours by then, but it may matter to us what the market’s expectation is in 1 year or 1 quarter because our clients might take their money back if the investment loses over those earlier horizons, robbing us of the chance to win over 3 years even if we were right.
So our added task is to step back from cases for long-term future cash flows to cases for expectations for long-term future cash flows at multiple earlier horizons. This means 2 time dimensions:
-
What eventually happens over future time periods, and
-
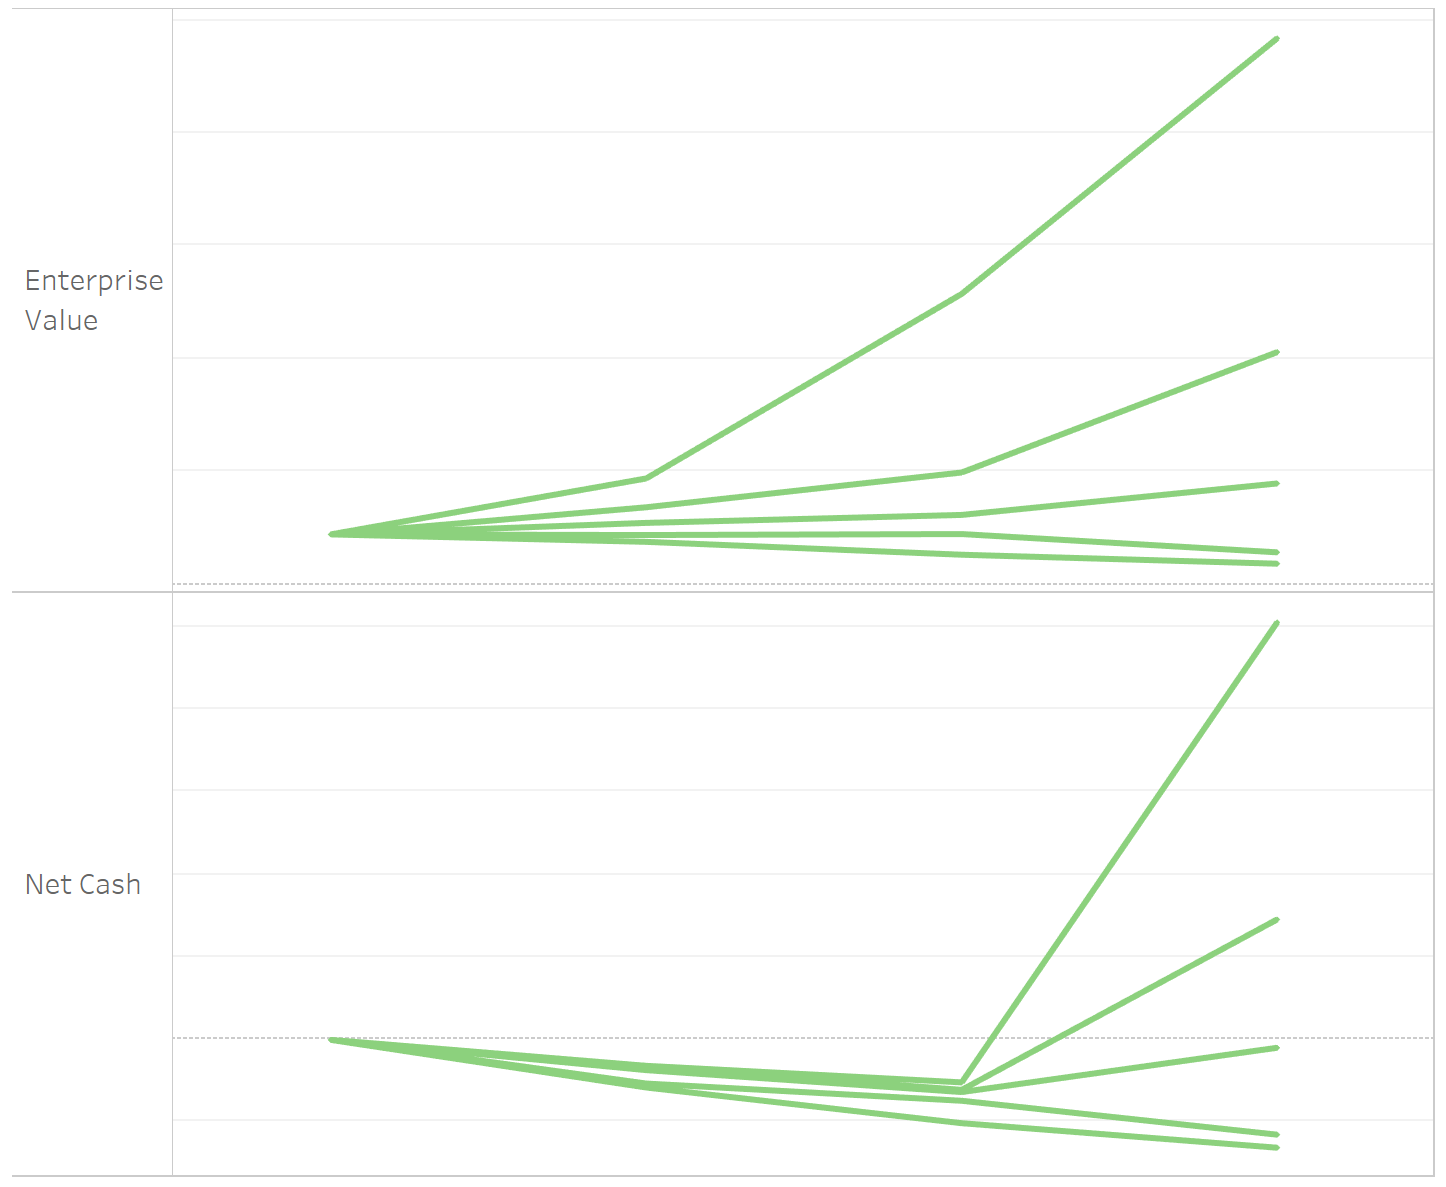
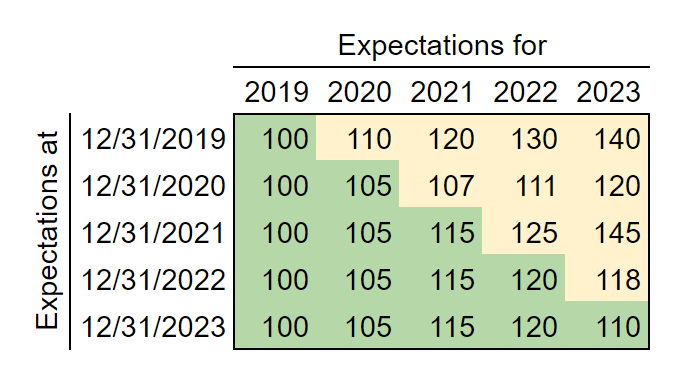
What investors expect for future time periods at each period before they move from future (yellow below) to past (green below).
Mind blown? Too hard? When we all reflect, we may note that we do this in our heads, and that is easier than making it explicit in spreadsheets and memos and slide decks, where extra dimensions like this are hard. But there are advantages to making expectations explicit, which is why managers and investors write spreadsheets and memos and slide decks, and the Bullet Point Network Platform makes it practical to make explicit not only one case for future long-term cash flows but also many cases for future long-term cash flows and even for earlier expectations about that long-term. That enables us all to amplify what’s in our heads, catching oversights and increasing confidence in our foresight.
We need to think through how cases for each driver from our first article may go from what is priced in today to the cases for what eventually happens. That involves thinking through serial correlation as well as what Economics Nobel Laureate Daniel Kahneman calls “temporal scope sensitivity.” The Bullet Point Network Platform’s Bi-Temporal Model of Future Horizons handles these so we all do not have to focus on them but instead can continue to focus on:
-
What do investors expect now, and
-
What are the odds for what will eventually happen
The Platform helps us all translate our views on those two points into cases for expectations between those points, which is essential to getting paid within our practical investment horizons.
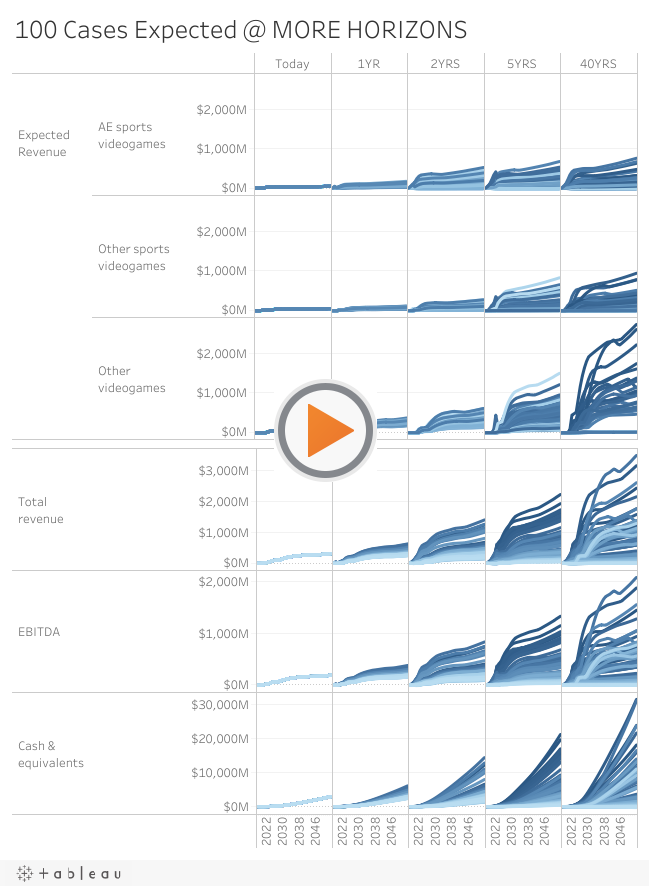
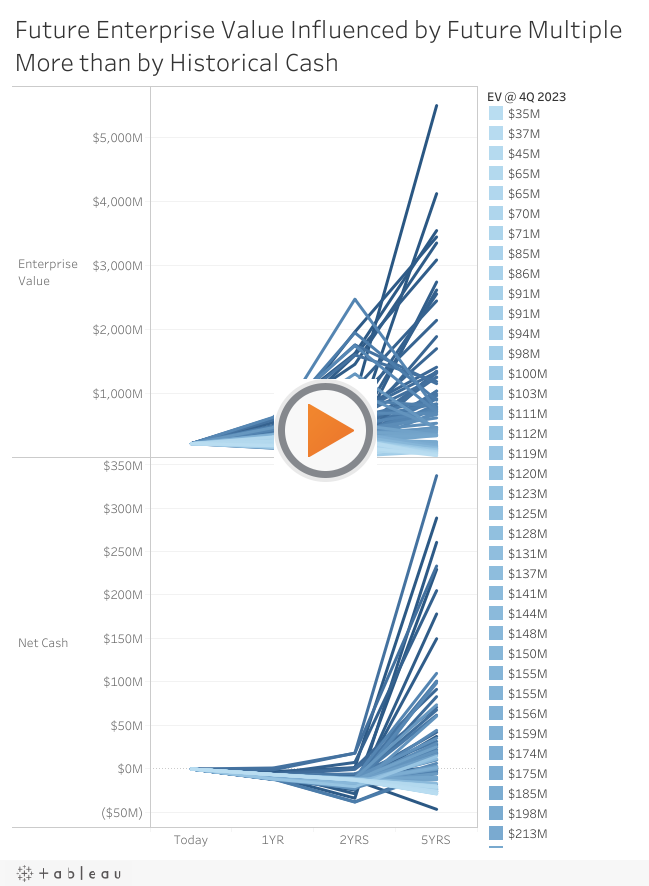
Remember the previous article’s cases for virtualgoods.shop’s long-term cash accumulation? (If you are reading on a smartphone, flipping to landscape mode helps with the interactive charts below)
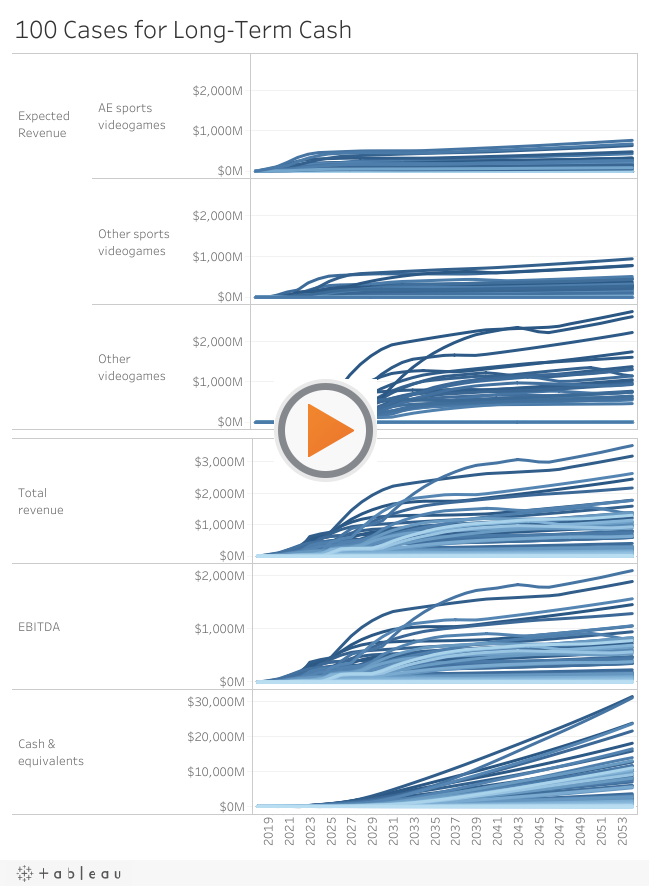
The Platform’s second time dimension enables us to consider scenarios not only for what investors will know about the long-term after it happens, like way out in 2050, but also for what they will expect about the long-term before it all happens, like at a target exit horizon in 5 years . . .
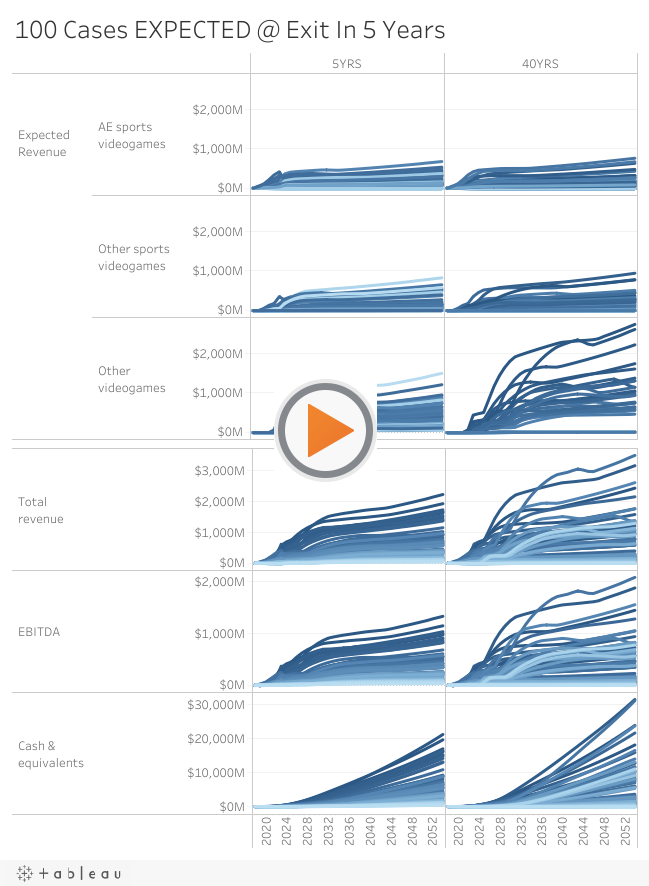
. . . and even at more, shorter horizons like 1 year or 2 years, where expectations may influence fundraising potential and dilution:
Cases for the Price Driven by those Expectations
Wait a minute, aren’t we missing something? How do the expectations at any horizon for long-term cash flows translate into a price at that point? Is it via a ___ multiple of ___ in ___ year?
There are many ways to fill in those blanks, most of them easy to do in measuring a past price in a past year. But how do we put odds on cases for how to fill in those blanks at future horizons, especially for growth companies whose outlooks are harder to compare to any real “comparables” than those of more stable, slow-growth companies? For a price at the 12/31/2023 horizon, why 10x 2024 forward revenue instead of 10x trailing revenue? Or instead of 2x trailing revenue? And do the answers change in cases wherein inflation expectations are 3% annually instead of 2% annually? Or if 10-year Treasury rates are 1% or 5%?
Many articles have been written about how to apply the most universally non-negative multiple, the revenue multiple, to the growthiest of growth companies, tech startups, but most of those articles simply pick today’s revenue multiple for a range of “comparables” and justify it with arbitrary math, claiming without justification that this multiple can be used for more deals at more times.
A more sincere review of revenue multiples for tech startups reveals giant ranges from 1x to over 600x, and some of the huge differences are between the same company at different times, such as Facebook ranging from under 10x to over 100x. Another objective article illustrates that even just in a single year, just among private “Unicorns” valued at $1B or more, revenue multiples ranged from 1x to 136x.
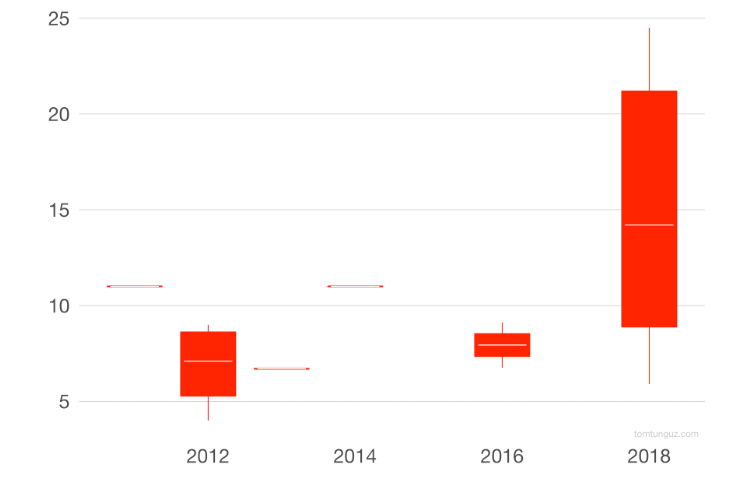
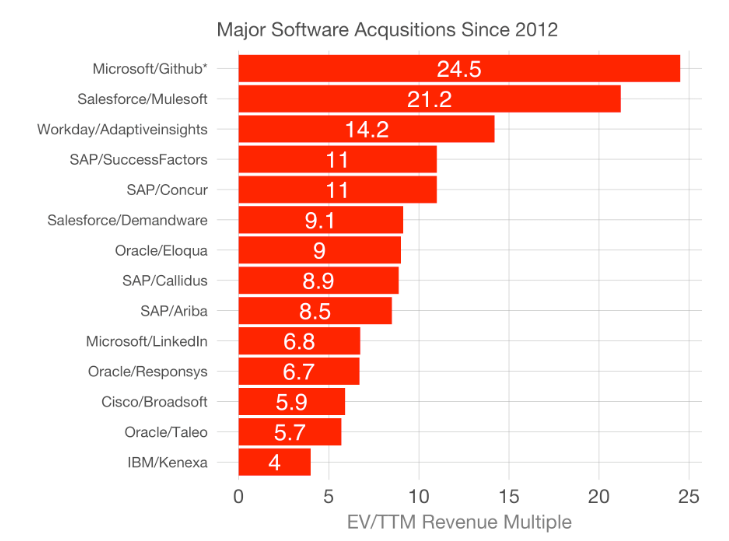
And revenue multiples can change radically over time, making it particularly problematic to anticipate future exit multiples mainly based on today’s multiples for comparables. Redpoint Ventures’ Tomasz Tunguz makes cogent observations about valuation multiples in his blog, such as that the entire range of revenue multiples for M&A in 2018 was above the entire range of revenue multiples for M&A in 2012 for the comparables group of Software-as-a-Service companies with over $100M in annual revenue:
Peter Fenton, Bill Gurley’s partner and fellow top-ten member of the 2018 Midas List, has been quoted as saying, “Never turn down a company based on valuation, because it is a mental trap.” When asked to explain this, he detailed that valuation is counterproductive when it is based on arbitrary multiples of the near-term but is actually useful when it is focused instead on the odds of “radical full potential” in the long-term:
There’s probabilistic outcomes and future world states that could occur for every investment . . . You have to be on the field practicing every day, working with companies that have the potential that may never get realized and then intersecting, when all the stars align, the companies where the potential is fully realized . . . What strikes me is that [short-term multiples valuation] thinking so dominates the trade . . . that it sabotages this underlying question of what does it look like in radical full potential, and I think that partners, the venture capitalists that are best suited to work with the company, have to believe in that but also be practical and realistic that there’s a lot of possible future world states and so you have to mitigate that by paying a price that encompasses those potential outcomes.
So how can we all pay a price that encompasses those potential outcomes? Fortunately, the Bullet Point Network Platform can help us all explain consistently when, for example, the odds of long-term full potential might drive investors to pay 10x forward revenue at an investment horizon in 5 years instead of 10x trailing revenue or 2x trailing revenue.
The least arbitrary of multiples, cash flow multiples, are the reciprocal of what real estate investors like to call the “cap rate,” which can be calculated from cost of capital minus expected future growth rate into perpetuity. The latter term in that calculation is the really vexing one, because it is influenced not just by current annual growth but moreso by the long-term asymptotes emphasized by Wei and Gurley. The key is forecasting expectations for those long-term asymptotes. We have that key, as we showed in our previous article, Step 2: Quantify Stories in Scenarios for Long-Term Cashflow.
So we can predict cases at each future investment horizon for many multiples of many metrics in many years, by:- Predicting cases for long-term cash flow expectations at each future investment horizon
- Putting an "exit multiple" on cash flow only at the long-term asymptotes that end the expectations’ S-Curves. As Michael Mauboussin explains in Expectations Investing, a company’s cash flow may grow only with inflation beyond those long-term asymptotes, making the cap rate’s "expected future growth rate into perpetuity" term no longer vexing but instead simply the expected inflation rate, for which it is much easier to predict cases.
- Predicting cases for investors’ opportunity costs, aka “cost of capital.” Predicting a single case for this is easier than predicting a single case for ___ multiple of ___ in ___ year, and predicting the odds of multiple cases for it loosens the reins further. The Bullet Point Network Platform can make it easy for all of us, since the Platform includes a Capital Markets Rates Model that incorporates . . .
- The Bullet Point Network co-founders’ decades experiencing the capital markets at senior levels
- Over a decade of developing patented software architecture and building capital markets models atop it to simulate that experience
- Ongoing daily work by the Bullet Point Network research team connecting statistical base rates with potential changes suggested by stories in the daily news, providing the continuous and incremental updating that Tetlock advocates
From these ingredients, the Platform’s Future Multiples Model can help us all produce realistic and non-arbitrary cases, at each investment horizon, for the blanks in ___ multiple of ___ in ___ year, and these cases for multiples correspond to the cases for the long-term cash flow expectations, including the asymptotes, that they value.
In the chart below, please click on an EV / revenue curve to see why investors may pay as high as 10x forward annual revenue at a target exit horizon in 5 years, or as low as 0.2x. These whys help us consider the odds of being above or below any given multiple, which provides invaluable perspective for decision-making. For example, despite a 11x forward revenue multiple today and a high case of a 24x forward revenue multiple in 2023, these whys suggest 75% odds of a multiple below 4.9x in 2023 and 75% odds of a multiple above 2.3x in 2023.
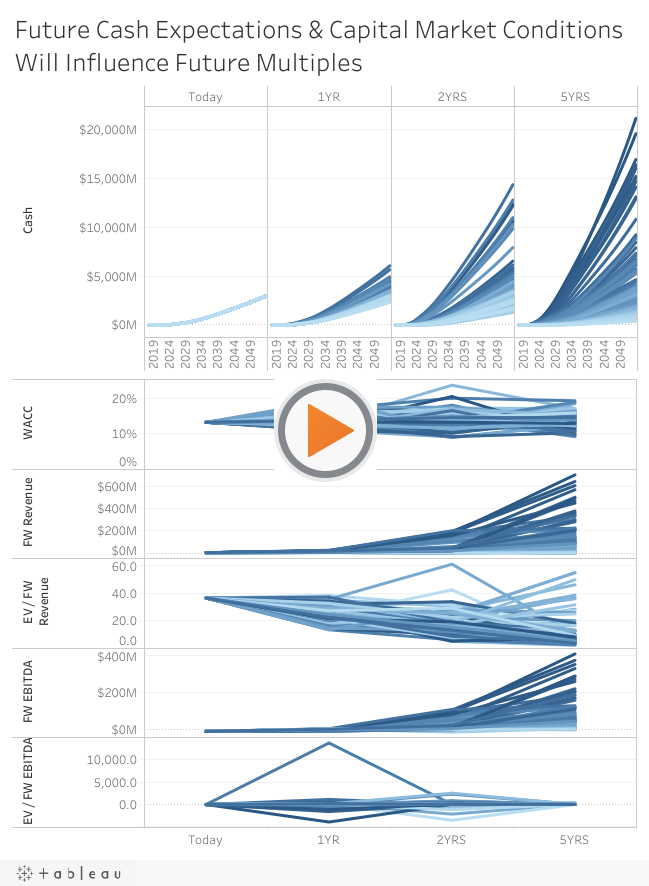
These future EV / revenue multiples are not simply a range of current multiples of comparables that may not really be comparable today, much less years into the future. Instead, we have useful probabilities for these multiples, and they are driven logically by cases for capital market conditions, and, most importantly, by expectations for the “radical full potential” to which Fenton refers.
The capability to do this enables us all to focus on our insights about business drivers, which the Platform helps us to translate into realistic scenarios for company cash flows, for investors’ future expectations about those cash flows, and for investors’ future prices for our investments. In the chart below, click the lowest cash in 2YRS to see that its case has a high valuation that will make it easy to fund that cumulative cash burn.
Quantifying the Stories illustrated in Step 1 in the Scenarios illustrated here in Step 3, this analysis suggests a 5-year return median of about 2x and expected value of about 5.5x. Ray Dalio advises us all to “make decisions as expected value calculations” because expected value represents, much better than the median or most likely case, the cumulative results that we will obtain from numerous strategy and investment decisions over time.
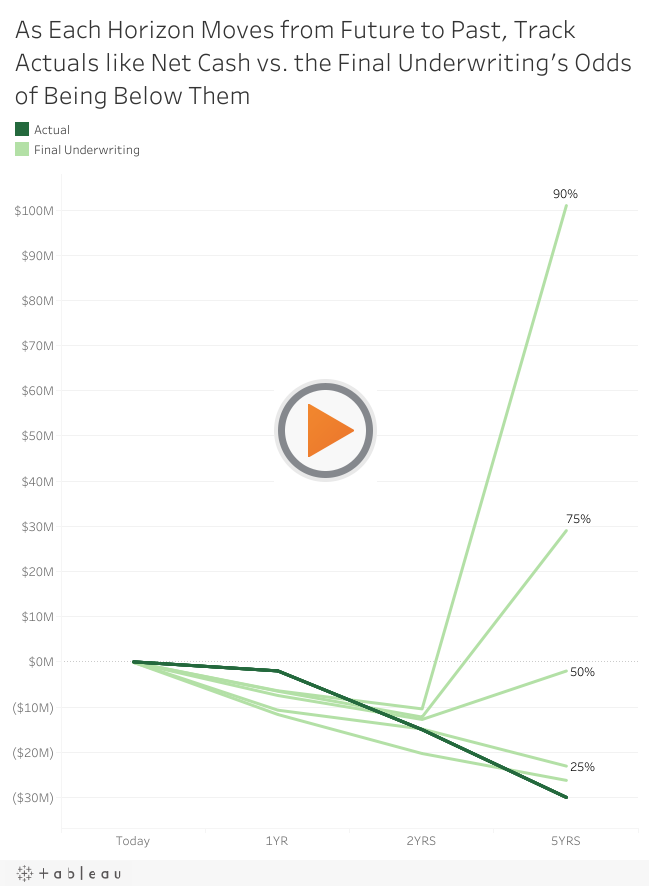
Furthermore, when we express our odds explicitly, then as each horizon moves from future to past, we can assess not just whether any measure, like Net Cash, “beat” or “missed” our outlook but more precisely what our odds were of being above or below it, which can help us to change our outlook more nimbly and also to measure and improve our ability to anticipate odds:
Bullet Point Network serves a client base of elite managers and investors who bring to our team companies and investments to work on together confidentially, Quantifying their Stories in Scenarios via these 3 steps to amplify their long-term returns.
They bring to the BPN team a business plan or investment thesis, plus their research and models that support it. Our team identifies templates in our Platform that suit the plan or thesis and responds within 5 business days with an Initial Underwriting that Quantifies their Stories in Scenarios to amplify the client's work into more scenarios for more confident strategy and investment decisions.
After the client provides ideas to improve this Initial Underwriting, she works iteratively with the BPN team to produce a Final Underwriting that supports high-confidence decisions.
Then with the Final Underwriting in our Platform, it continues to live and breathe. As the environment changes and the client accumulates information, such as around quarterly board meetings, the client and BPN's team can attach research and change judgments regularly to producing Reunderwritings that update the investment's outlook regularly and sincerely, without the enormous work that it would have taken to retrieve a slide deck, memo, and spreadsheet from a folder and rewrite them.
If you might like to try an Initial Underwriting with us, please tell us why below.